Step 4: Audit the system
A practical framework for Responsible AI in algorithmic pricing
How do we test fairness?
What makes an audit different from a test
An audit is different from testing, and the difference is not primarily statistical. It is procedural. A test asks whether you can find a problem. An audit asks whether you can demonstrate compliance. The distinction changes what a clean result actually means.
Consider a parallel from clinical medicine. A pharmaceutical company that analyses its trial data and then decides which outcomes to report and which statistical tests to apply has not run a clinical trial in any meaningful sense. It has run a search for a favourable result. The statistical methods may be identical, but the process is not, and regulators do not accept it as evidence that a drug works. The same logic applies to insurance fairness audits. An insurer that looks at pricing data, notices which analysis produces the most comfortable result, and then presents that analysis has not audited its system. It has searched for the best story.
Pre-commitment solves this problem. Every decision about what to test, how to test it, what response variable to use, which factors to control for, and what tolerance band defines a pass must be fixed before the data is examined. The audit then follows the pre-specified protocol regardless of what it finds. Only then does the result constitute evidence rather than advocacy.
In practice this means the audit protocol is written, reviewed, and signed off by the accountable technical owner and an independent reviewer before the quote sample is collected or the pricing data is extracted. Changes to the protocol after data has been seen must be documented and disclosed. This is standard practice in pharmaceutical trials and clinical research; it is increasingly what insurance regulators expect as well.
An audit tests whether a deployed pricing system meets the fairness standard from Step 1. All design choices are fixed before examining data, then each test is classified as pass, fail, or insufficient information (Huang and Hooker 2026).
Mini-glossary
| Term | Plain language |
|---|---|
| Conditional demographic parity (CDP) | After controlling for legitimate risk factors, are average prices equal across protected groups? |
| Proxy discrimination (PD) | Does a rating variable’s role change when a protected attribute enters the model? |
| Legitimate factors (X_\ell) | Risk-related controls the regulator accepts in an audit regression |
| TOST | Equivalence testing - pass only if evidence shows the disparity is within tolerance (used for CDP) |
| HC3 / corrected SE | Sandwich standard errors for deterministic pricing outputs. Classical OLS defaults are unreliable when residuals are approximation error |
| Proxy-imputed protected class | Race or ethnicity inferred from name, geography, or similar when direct collection is restricted (e.g. BISG, BIFSG, zip composition) |
End-to-end audit flow
End-to-end flow for the fairness audit protocol (Huang and Hooker 2026).
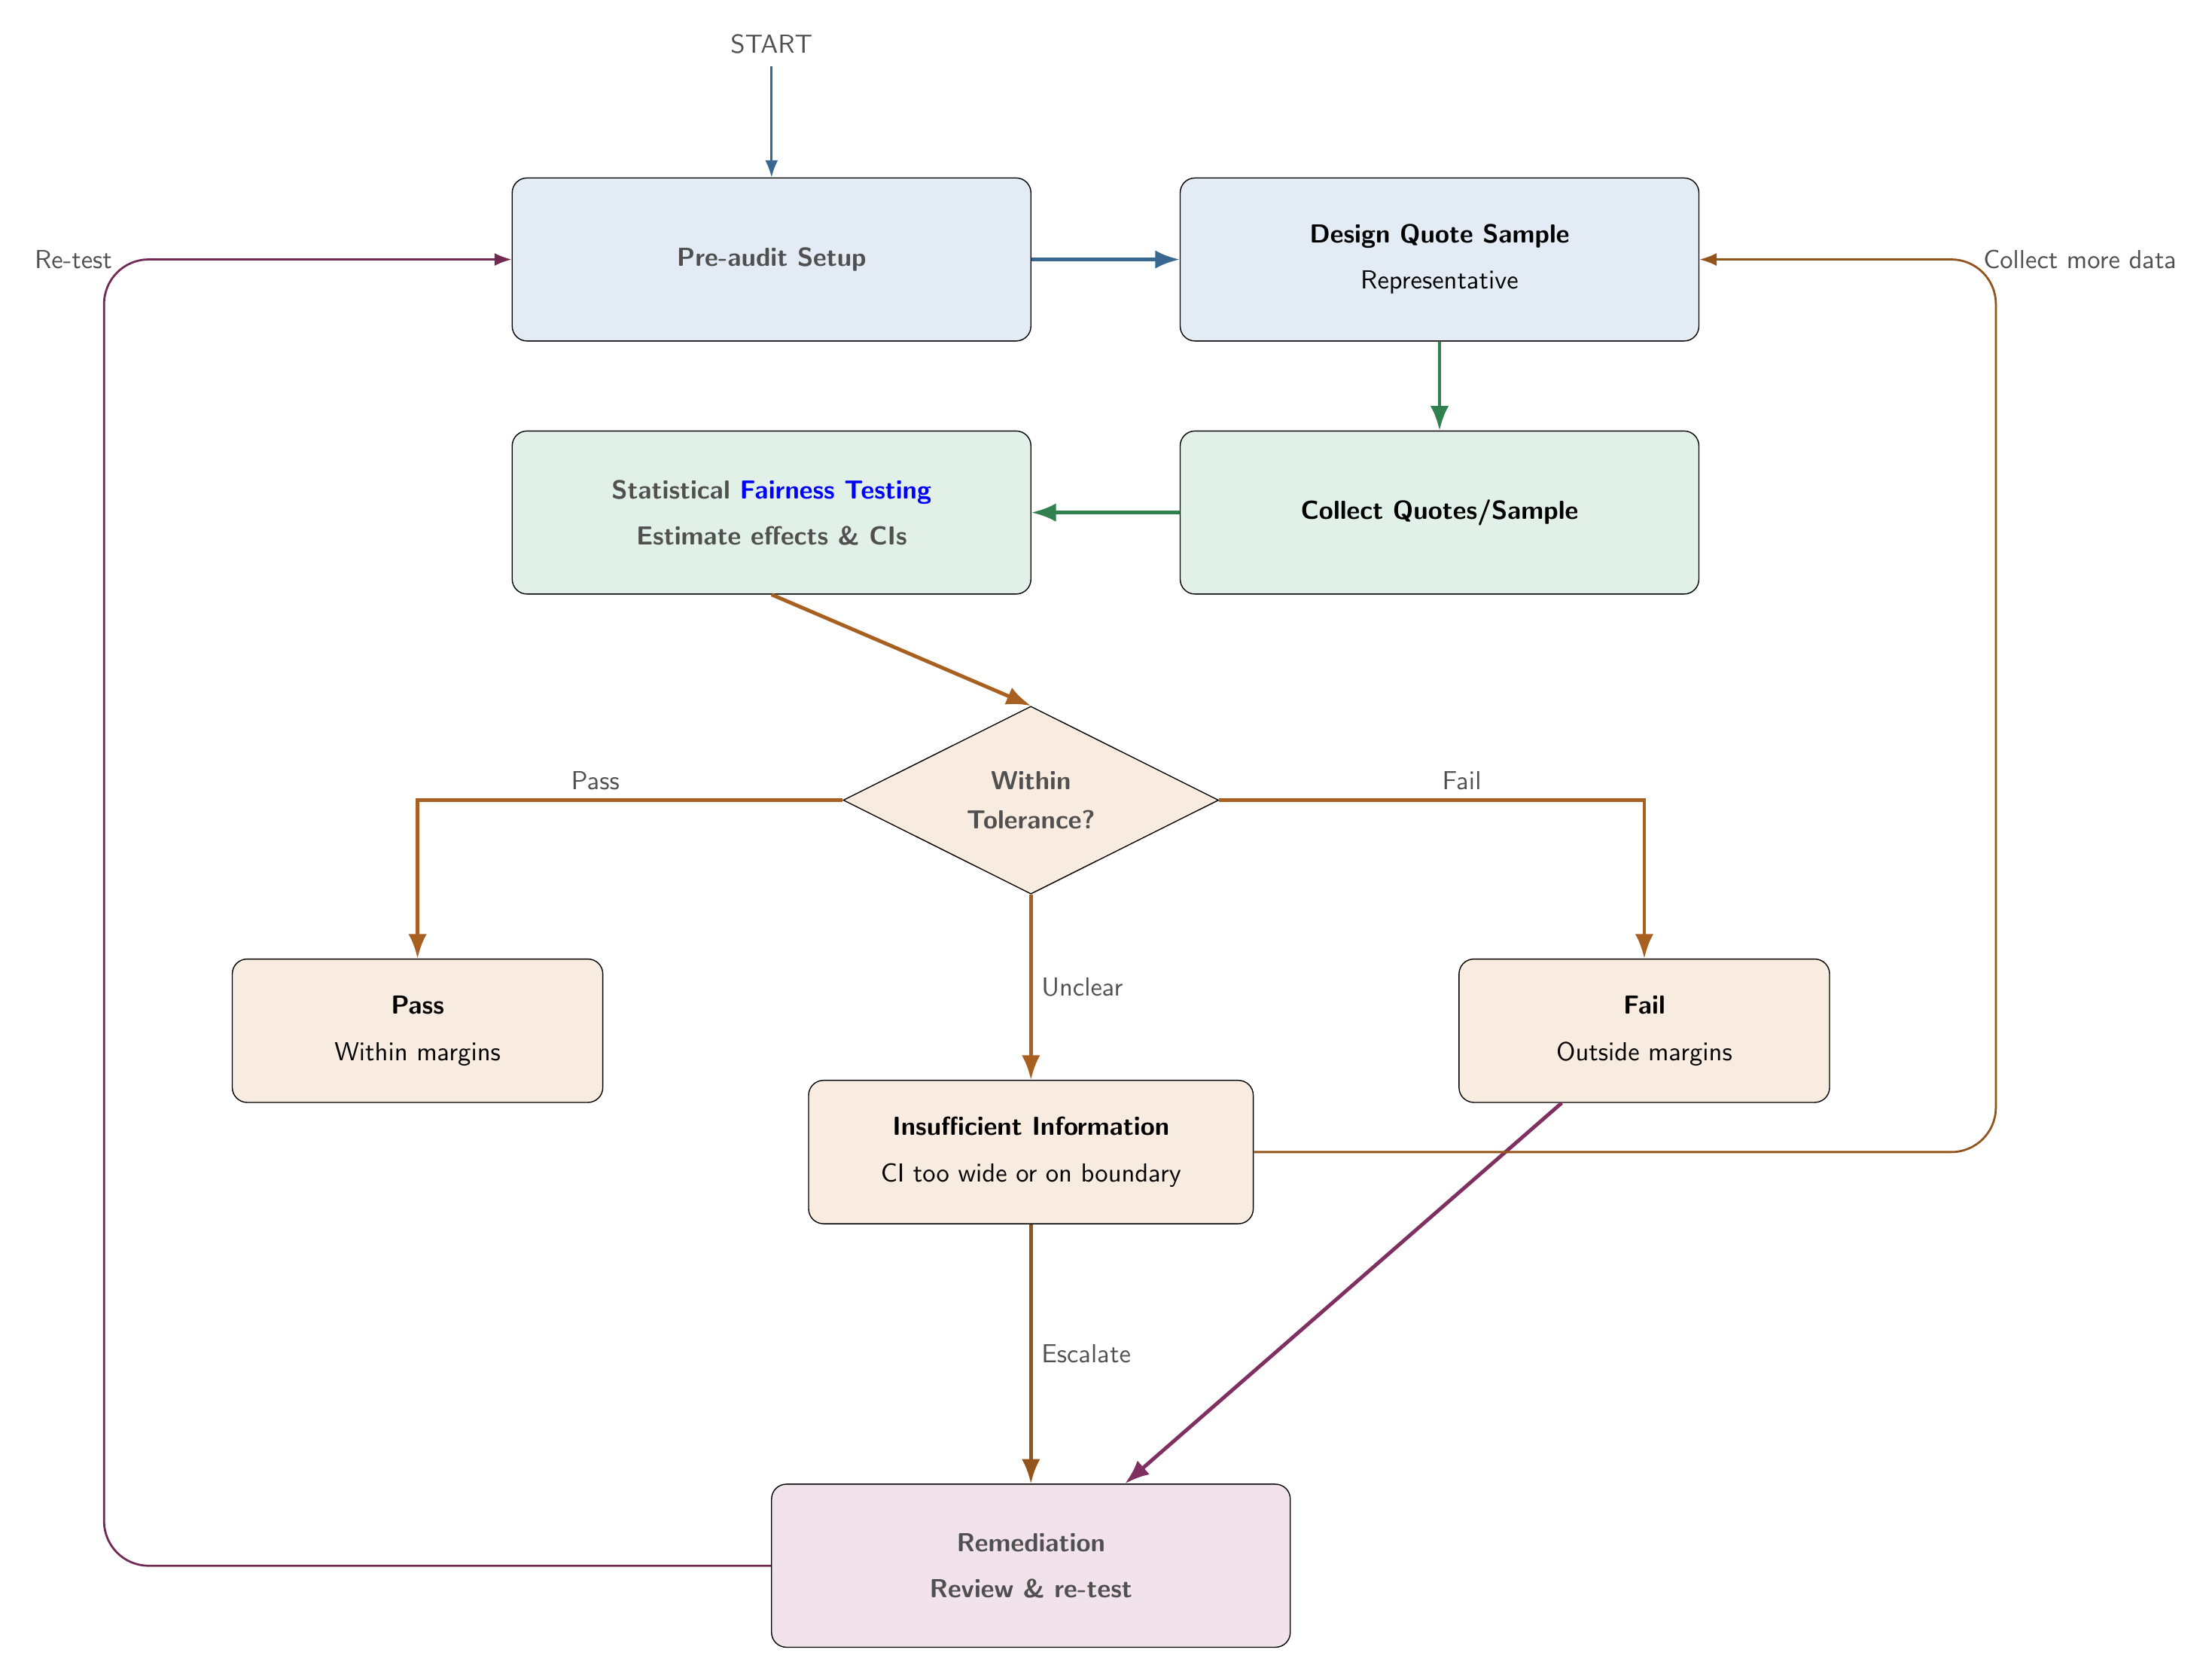
All design choices must be fixed before examining data. Post-hoc changes to criteria, margins, or samples undermine auditability and stated error control.
Pre-audit setup
All notation below is defined in the mini-glossary above. Complete and sign off steps 1–8 before any pricing data is extracted or examined.
- Select a fairness criterion: proxy discrimination (PD) when auditing specific rating variables suspected of proxying the protected attribute; conditional demographic parity (CDP) when evaluating the system-level price gap after controlling for legitimate risk factors. Other criteria from Step 1 may apply in your jurisdiction.
- Specify the protected attribute A - document the attribute and, if proxied, the inference method and its limitations.
- Specify legitimate rating factors X_\ell aligned with Step 1 and regulatory guidance.
- Define the response variable P - quoted premium, pure premium, or loss ratio (claims paid as a share of premiums earned). The choice sets the economic meaning of any disparity.
- Set tolerance margins for CDP: level-gap margin \delta, ratio margin \tau (e.g. 5% gap, 0.80 adverse impact ratio), significance level \alpha. For PD: \alpha and minimum relative shift \rho_{\min} (e.g. 10%).
- Specify the standard error estimator HC3 for CDP by default. Full cross-covariance for the PD coefficient-shift test.
- Design a representative quote sample stratified profiles submitted within a short time window. Plan sample size for adequate power (insufficient data yields insufficient information, not a pass).
- Define test scope e.g. per company, per product. Document whether multiple proxy variables are tested and how multiplicity is handled.
Proxied protected attributes
When race or ethnicity cannot be observed directly, regulators and firms sometimes infer it using BISG (Bayesian Improved Surname Geocoding), BIFSG (Bayesian Improved First Name Surname Geocoding), zip composition, or similar methods. If that proxy enters the audit regression as a categorical protected attribute, the estimated disparity for the proxy group is not the same quantity as the true disparity between groups (Xin et al. 2026).
Misclassification distorts the results. Estimated gaps can shrink toward zero even when the overall accuracy of the proxy looks high. Proxy errors can also be correlated with geography, income, and the pricing residuals after legitimate controls are applied, causing estimated disparities to be either understated or overstated relative to what a true-group analysis would show.
Treat proxy-based results as diagnostic signals, not definitive proof of compliance or discrimination. Document the proxy method, its known error rates where available, and these limitations in the audit protocol. Colorado’s draft BIFSG testing framework and New York Circular Letter No. 7 both contemplate inferred protected-class status in regression-based assessments (Colorado Division of Insurance 2023; New York State Department of Financial Services 2024; Xin et al. 2026).
Statistical testing
Fairness audits typically regress quoted premiums on a protected attribute and legitimate rating factors, then read off confidence intervals for the protected-group effect. That workflow is only valid if the standard errors are correct. For algorithmic pricing, deterministic outputs invalidate classical variance formulas, and CDP calls for equivalence testing rather than conventional significance testing (Huang and Hooker 2026).
Deterministic pricing and corrected inference
Pricing algorithms are usually deterministic. The same profile always returns the same price, so the audit response is a fixed function of the inputs, not a random draw (Huang and Hooker 2026).
The audit fits a statistical model to approximate the pricing algorithm. The gaps between the model’s approximation and the actual prices are approximation errors, not random sampling noise. Standard statistical formulas assume random noise and can therefore produce wrong confidence intervals: sometimes too narrow (flagging fair systems as failing), sometimes too wide (letting genuine violations through). In the Illinois application in Huang and Hooker (2026), corrected and uncorrected standard errors for the same insurers differed by large factors, and the direction of the bias could not be predicted in advance.
The practical fix is to use corrected standard errors (HC3) that are built from the actual residuals at each observation rather than a single average error estimate. HC3 also reduces the influence of unusual customer profiles that can otherwise distort the results, particularly when the audit sample is not spread evenly across all risk types and territories.
The proxy discrimination test introduces a further complication. It compares a rating variable’s influence across two different models fitted to the same pricing data. Treating those two estimates as if they came from independent samples overstates uncertainty and makes the test too conservative. A cross-covariance correction is needed to account for the shared data (Huang and Hooker 2026).
Getting the standard errors wrong changes the audit verdict. Corrected inference should be pre-specified before examining outcomes.
- Conditional demographic parity (CDP). Regress the pricing outcome on the protected attribute and legitimate factors. Test whether the protected-group coefficient lies within pre-specified ratio and level-gap bands using equivalence testing (TOST). A pass requires positive evidence of compliance within tolerance, not merely failing to detect a disparity.
- Proxy discrimination (PD). Compare a rating variable’s coefficient in a restricted model (without the protected attribute) and an extended model (with it). Use the corrected cross-covariance for the coefficient shift. PD uses a two-part rule (statistical significance plus a minimum relative shift), not TOST in the same form as CDP.
Why equivalence testing is required
The most widely understood statistical test asks a simple question: is there evidence of a difference? You set a threshold (typically a 5 per cent p-value) and report whether the data provide enough evidence to reject the hypothesis that the difference is zero. If the p-value is above the threshold, the result is “no significant difference found.”
This framing is a poor fit for compliance auditing (Huang and Hooker 2026). “No significant difference found” is not the same as “the system is fair.” With a small sample, even a large and practically important disparity might not reach significance, simply because you do not have enough data to detect it reliably. A non-significant result is absence of evidence, not evidence of absence. Under this approach, the practical burden falls on the regulator or reviewer to find a violation. An insurer with a small dataset or a poorly designed quote sample can effectively pass every test without demonstrating anything.
Equivalence testing (TOST, or two one-sided tests) reverses the burden. Developed originally in pharmaceutical regulation to demonstrate bioequivalence rather than merely the absence of a detectable difference (Schuirmann 1987), TOST asks not whether you can find a difference, but whether you can demonstrate that any difference is small enough to be within an acceptable tolerance. The null hypothesis is that the difference is large (at least as large as the tolerance band), and you reject it only if the data give you strong positive evidence that the gap falls inside the band. Insufficient data yields an “insufficient information” verdict, not a pass. The insurer must provide evidence of fairness, not merely an absence of detected unfairness.
This matches how regulatory tolerance bands are already formulated. Colorado’s proposed 5 per cent price-gap band and the 0.80 adverse-impact ratio widely used in US employment law both define the tolerance band. TOST is the statistical procedure that properly interrogates whether that band has been met.
| Approach | Null hypothesis | What a “pass” means | Who must prove what | Large samples | Small samples |
|---|---|---|---|---|---|
| Significance testing | Gap = 0 | Failed to detect a violation (not necessarily fair) | Regulator or reviewer must detect a violation | Flag trivial gaps as violations | Miss genuine gaps |
| TOST equivalence testing | Gap \geq tolerance | Positive evidence the gap is within tolerance | Insurer must demonstrate compliance within tolerance | Narrower CIs help confirm fairness | Wide CIs yield insufficient information |
Under significance testing, the practical burden falls on the regulator or reviewer to find a material violation. A non-significant result only means no gap was detected in that sample. It does not show that pricing is fair. Under TOST, the burden shifts to the insurer (or model owner) to provide positive evidence that any gap lies within pre-specified tolerance bands. Insufficient information is not a pass.
Regulatory tolerance bands already define an equivalence region. Colorado’s 5% price-gap discussion maps to a level margin \delta. The familiar 0.80 adverse-impact ratio maps to a ratio margin \tau. TOST matches how pre-committed audit protocols are meant to work (Huang and Hooker 2026; Colorado Division of Insurance 2023). Exact legal allocation of burden varies by jurisdiction. This describes one audit design, not legal advice.
For CDP, a pass requires the confidence interval for the protected-group effect to lie entirely inside both the level-gap band (-\delta, +\delta) and the log-ratio band implied by \tau. A fail requires the interval to lie entirely outside. If the interval is too wide to settle either case, the verdict is insufficient information. That outcome is not a pass and should trigger more data or a pre-specified escalation step.
Three outcomes
| Outcome | Meaning | Action |
|---|---|---|
| Pass | Confidence interval lies entirely within the tolerance band (positive evidence of compliance) | Document. Proceed with monitoring |
| Insufficient information | Interval too wide to confirm pass or fail. Reflects limited data, not a pass | Collect more data or follow a pre-specified escalation procedure |
| Fail | Confidence interval lies entirely outside the tolerance band (material disparity) | Remediate, then re-test (return to Step 2 or Step 1) |
On fail or unclear CDP results, a proxy-discrimination screen can identify candidate driver variables. Remediation may include recalibration, fairness constraints at retraining, or ongoing monitoring with re-audit triggers.
Feature importance check
The protocol above tests whether premiums or prices meet quantitative fairness criteria such as CDP or proxy discrimination after legitimate controls. That is the primary audit path in this playbook and in Case Study: Fairness Testing.
Some filing and governance workflows use a different, variable-level check instead: partial dependence plots and related interpretability tools ask whether a given rating factor appears to influence model predictions. This variable-level check asks whether a rating factor influences model predictions. It does not establish whether average outcomes are equal across protected groups.
Industry reports such as Society of Actuaries (2021) catalog similar tools for actuaries and summarize NAIC review practices, but they are practitioner guidance, not regulatory requirements.
Treat partial dependence plots (and other permutation-based interpretation tools) as an optional supplement for ML model documentation, not a substitute for outcome-based testing. Xin et al. (2025) argue that black-box models plus interpretability plots should be a last resort: prefer interpretable models such as GLMs or generalised additive models (GAMs) when they achieve comparable predictive performance (see Step 2). A plot that shows little marginal effect for a sensitive factor does not prove fair group-level pricing. The same paper shows that these tools can be manipulated to hide age- or race-related patterns while retaining almost all predictions on real data. Where they are used in filing or internal review, pair them with outcome audits, examine the underlying data, and use multiple interpretation tools (such as individual conditional expectation curves shown in full, including percentile bands) to help reveal anomalies that averaging hides.
Governance and monitoring
| Role | Responsibility |
|---|---|
| Accountable technical owner (e.g. chief actuary or model validation lead) | Sign off the audit protocol before data is examined |
| Independent reviewer | Replicate the analysis from raw data and confirm the verdict |
| Model owner | Remediate on fail or insufficient information; own re-test timeline |
| Legal and compliance | Confirm that the pre-specified criterion and tolerance bands align with current regulatory requirements |
| Senior management or board | Receive the audit verdict and approve any remediation plan |
Re-audit whenever the pricing model changes, a new regulatory requirement takes effect, or audit statistics show material drift from the baseline. Store the complete quote dataset and a reproducibility manifest (code, package versions, random seeds) so the result can be independently replicated.
If filing documentation relies on partial dependence plots or variable-importance plots for ML models, treat them as supplementary narrative evidence only. Outcome-based CDP and proxy-discrimination tests remain the primary compliance path (see Feature importance check).
Checklist
This checklist covers audit execution. Roles, monitoring, and remediation ownership are in Governance and monitoring.
| Task | Typical owner |
|---|---|
| Protocol written and signed off before data extraction | Compliance / Model risk |
| Protected attribute, legitimate factors, and response variable documented | Legal / Actuarial |
| Tolerance margins and significance level fixed in advance | Compliance / Actuarial |
| Corrected inference (HC3 for CDP, cross-covariance for PD) pre-specified | Actuarial / Data science |
| CDP (TOST) and/or PD (two-part) tests applied as pre-specified | Actuarial / Data science |
| Three-outcome classification documented (insufficient information ≠ pass) | Compliance |
| Audit dataset and reproducibility manifest stored | Data science / MLOps |
| Verdict and any remediation plan escalated to senior management | Model risk / Legal |